Social and Economic Indicators
Life Expectancy, Total Fertility and Infant Mortality
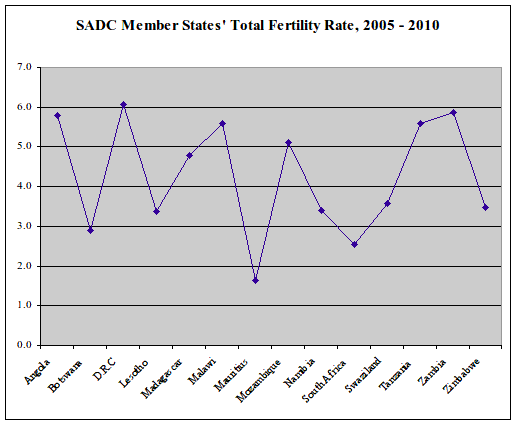
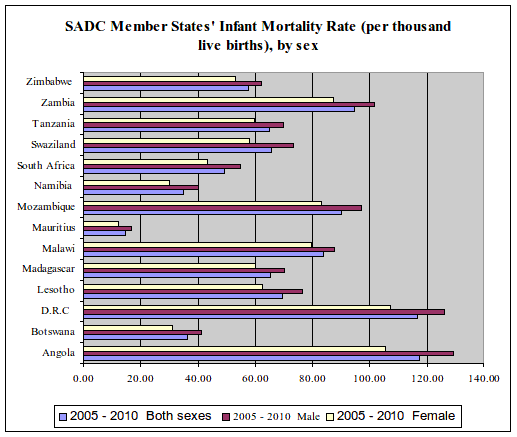
Life expectancy at birth has improved ranging from 44.1 years to 72.7 years between 2005 and 2010 (See table below). Similarly, the region's infant mortality and fertility have also improved over the same period.
| Country | 1990 - 1995 | 1995 - 2000 | 2000 - 2005 | 2005 - 2010 | ||||||||
|
Both sexes |
Men |
Women |
Both sexes |
Men |
Women |
Both sexes |
Men |
Women |
Both sexes |
Men |
Women |
|
|
Angola |
42.5 |
40.7 |
44.3 |
43.0 |
41.2 |
44.9 |
44.4 |
42.6 |
46.3 |
46.8 |
44.9 |
48.8 |
|
Botswana |
63.3 |
60.9 |
65.5 |
55.3 |
53.3 |
57.1 |
48.2 |
47.5 |
48.7 |
54.9 |
54.6 |
54.8 |
|
D.R.C |
47.6 |
45.7 |
49.5 |
45.3 |
43.6 |
47.1 |
47.7 |
46.0 |
49.3 |
47.5 |
45.9 |
49.0 |
|
Lesotho |
60.3 |
58.3 |
62.1 |
55.5 |
53.0 |
57.6 |
46.0 |
44.0 |
47.5 |
45.3 |
44.5 |
45.8 |
|
Madagascar |
52.6 |
51.4 |
54.0 |
55.3 |
53.9 |
56.8 |
57.7 |
56.2 |
59.2 |
60.1 |
58.5 |
61.8 |
|
Malawi |
50.9 |
49.6 |
52.2 |
52.2 |
50.4 |
54.0 |
50.1 |
48.5 |
51.7 |
52.9 |
51.8 |
53.8 |
|
Mauritius |
69.9 |
66.3 |
73.9 |
70.7 |
67.0 |
74.6 |
72.0 |
68.6 |
75.4 |
72.7 |
69.3 |
76.3 |
|
Mozambique |
44.4 |
42.7 |
45.9 |
47.3 |
45.5 |
48.9 |
47.6 |
46.2 |
49.1 |
47.8 |
46.9 |
48.7 |
|
Namibia |
62.9 |
60.9 |
64.9 |
61.7 |
59.8 |
63.6 |
56.7 |
55.4 |
57.8 |
61.4 |
60.3 |
62.3 |
|
South Africa |
61.3 |
57.8 |
65.2 |
58.6 |
55.3 |
62.2 |
53.1 |
50.8 |
55.5 |
51.6 |
49.9 |
53.2 |
|
Swaziland |
60.7 |
58.5 |
62.8 |
56.1 |
54.0 |
58.1 |
46.1 |
45.4 |
46.8 |
45.8 |
46.3 |
45.2 |
|
Tanzania |
50.3 |
48.5 |
52.2 |
50.0 |
48.5 |
51.5 |
52.0 |
51.1 |
52.9 |
55.4 |
54.6 |
56.2 |
|
Zambia |
49.6 |
47.9 |
51.3 |
43.9 |
42.4 |
45.4 |
41.6 |
40.9 |
42.3 |
45.2 |
44.6 |
45.6 |
|
Zimbabwe |
58.3 |
54.5 |
62.5 |
47.5 |
44.0 |
51.4 |
41.2 |
39.4 |
42.9 |
44.1 |
43.4 |
44.3 |


