Social and Economic Indicators
SADC Population
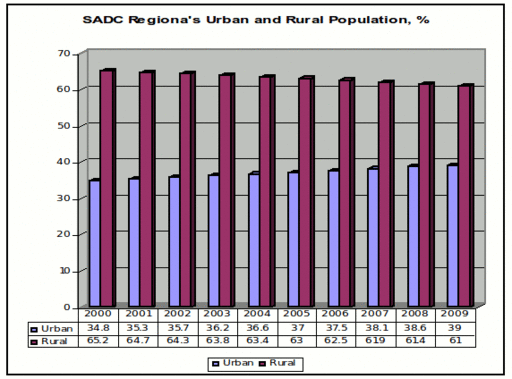
In 2010, the total population of SADC was 277 million with 39 per cent living in urban areas. The population of Member States ranges from of DRC with 72.8 million to Seychelles with 0.9 million (See table below).
| Population in SADC-Midyear, Million, 2006 – 2010 | |||||
| 2006 | 2007 | 2008 | 2009 | 2010 | |
| Angola | 15.9 | 16.3 | 16.8 | 17.3 | 17.8 |
| Botswana | 1.7 | 1.8 | 1.8 | 1.8 | 1.8 |
| DRC | 63.7 | 65.8 | 68.1 | 70.4 | 72.8 |
| Lesotho | 1.9 | 1.9 | 1.9 | 1.9 | 1.9 |
| Madagascar | 19.2 | 19.7 | 20.2 | 20.8 | 21.3 |
| Malawi | 12.8 | 12.9 | 13.1 | 13.5 | 15.9 |
| Mauritius | 1.3 | 1.3 | 1.3 | 1.3 | 1.3 |
| Mozambique | 19.9 | 20.6 | 21.2 | 21.8 | 22.4 |
| Namibia | 2.0 | 2.0 | 2.1 | 2.1 | 2.1 |
| Seychelles | 0.9 | 0.9 | 0.9 | 0.9 | 0.9 |
| South Africa | 47.4 | 47.9 | 48.7 | 49.3 | 50.0 |
| Swaziland | 1.0 | 1.0 | 1.0 | 1.0 | 1.1 |
| Tanzania | 37.5 | 38.3 | 39.5 | 40.7 | 42.0 |
| Zambia | 11.8 | 12.2 | 12.5 | 12.9 | 13.0 |
| Zimbabwe | 12.0 | 12.0 | 12.1 | 12.2 | 13.5 |
| SADC Region | 248.0 | 253.8 | 260.3 | 267.1 | 277.0 |
|
Source: Figures submitted and validated by NSOs of SADC Member States |
|
||||
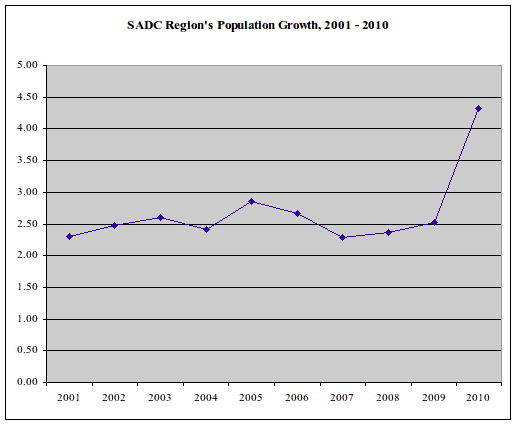
As shown in the graph below, the SADC Region as a bloc has registered steady population growth averaging about 2.5% before a sharp increase in 2010 to 4.31%.

The graph below shows distribution of the population between urban and rural areas.

